



Intempt
A brass periscope rising out of the waves with a glowing lens.

See who dropped, not just how many.

Ties each feature to activation, retention, and revenue on the same profile. No Mixpanel hand-off.

Start for free
G2
0.0on G2
10B+events
500M+users
7+years profitable
50+enterprises

See who dropped, not just how many.

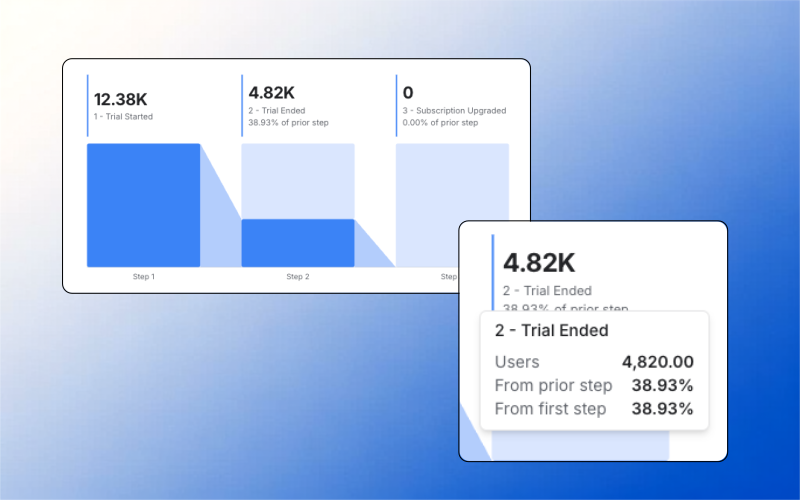
Every funnel bar is clickable. Land on the exact users who abandoned that step, and let the Data Analyst agent turn it into the next play - segment, message, or launch a journey.

  • Drop-offs link to the peopleClick the bar and get the users who fell out at that step.
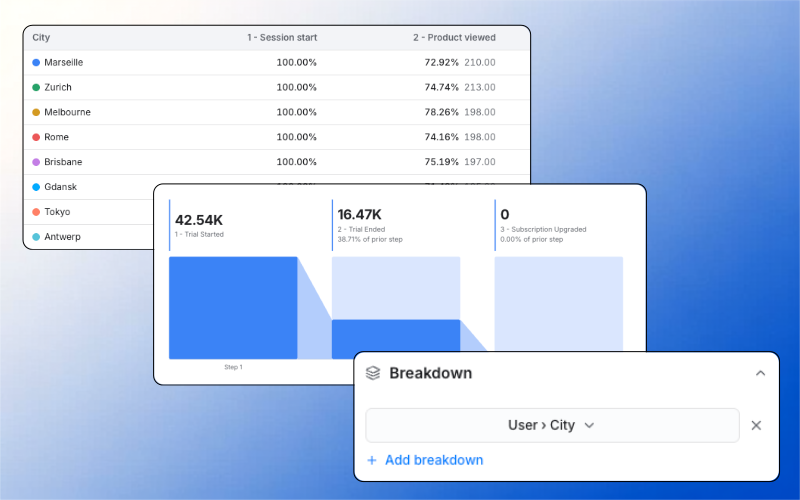
  • Break down without rebuildingSegment, device, channel, UTM or any custom attribute, on the funnel you already have.
  • Act from the funnelExport the list or start a journey without leaving the report.
See who dropped, not just how many

Find out why activation fails.

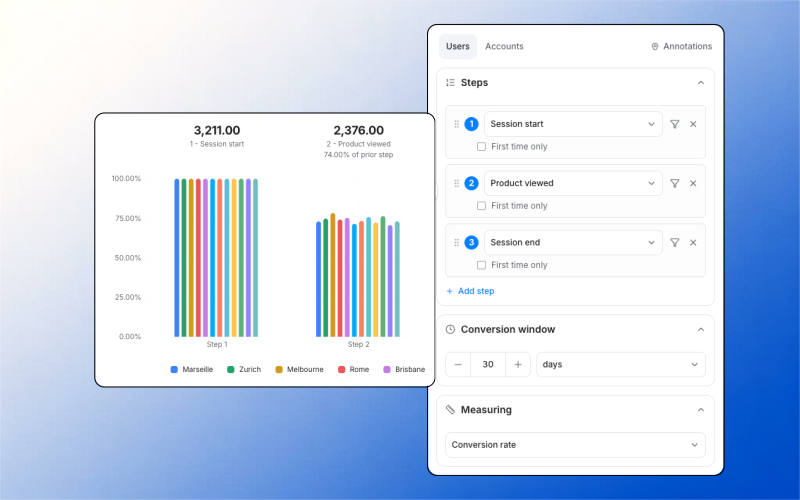
Path analysis across the journey from signup to activation, comparing users who converted against users who left, to find the milestone that actually predicts retention.

  • Paths in both directionsTrace what happened after an event and what led to it.
  • Retention heatmapsShows which early actions predict whether a cohort is still there months later.
  • Converters against churnersThe behavioural difference between the two groups, written out rather than charted.
Find out why activation fails

Cohort retention that means something.

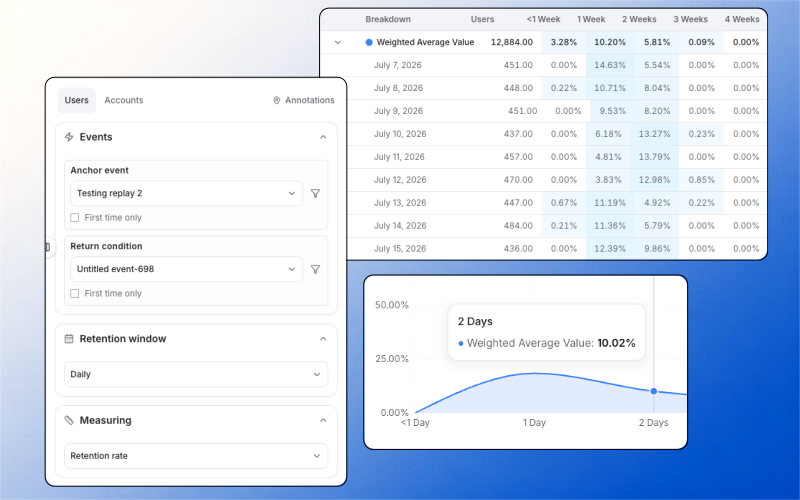
Pick your own anchor event and return condition. Weekly heatmaps by acquisition period, so you see which cohorts are healthy and which are quietly fading.

  • Curves from real eventsCohort curves and weekly heatmaps are built on tracked behaviour, not survey data.
  • Any event anchors a cohortPick the event that starts the cohort and the one that counts as returning.
  • Act from the cohortStart a re-engagement journey from the cell you are looking at.
Cohort retention that means something

What product analytics costs (2026)

ToolCost at ~50-person SaaSNote
Mixpanel~$8,400/yr20M events/month free tier, one of the most generous
Amplitude~$36,000/yrRoughly 4× Mixpanel at comparable usage
PostHog~$200-400/moSelf-host option, engineering-led
HeapHighest of the fourAutocapture, priciest at comparable volume

The complaint that actually kills these deployments is not price. It is that setups rot. Inconsistent event names and broken user IDs make funnels and segmentation untrustworthy, and once a team stops believing the numbers the tool is dead regardless of what it cost. Auto-capture and identity resolution matter more than feature count.

Sources: Monetizely product analytics cost comparison 2026 · vendor pricing pages.

Explore more ways Intempt drives revenue.

Connected outcomes across the platform.

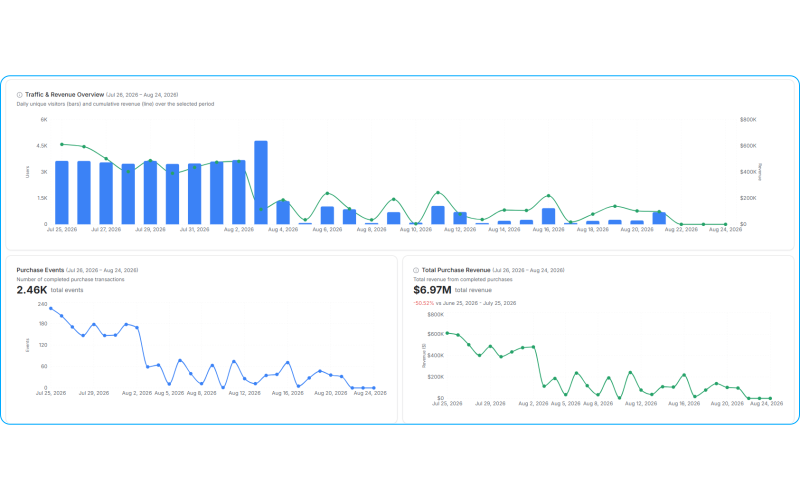
Traffic and revenue analytics

Teams love it

They stopped stitching tools andhired one system.

StockInvest

Acquisition and retention are one connected motion. Personalizing the path before signup only pays off when the same system carries the user through onboarding afterward.

Anonymous traffic was not turning into registered users, and acquisition and retention were run as two separate problems. We ran Experiences on the anonymous visitor flow to put the right content and CTAs in front of each visitor, then handed new signups to automated Journeys for onboarding and deeper engagement.

455,396

users instrumented

Read the full research
FieldsUSA

Judge experiments on revenue per visitor instead of conversion rate. A variant can win on conversions and still lose on revenue, and repeat buying only shows up when the whole journey is in one view.

High-intent shoppers browsed a large, specialized outdoor catalog, and browsing, product interest and purchase history sat in different places. We unified them into one customer view, then ran real-time personalization, intent-based segmentation and timely follow-ups on top of it, judging experiments on revenue per visitor.

Read the full research
Hoperfy

Build the pipeline on observed signals. When follow-ups trigger on intent, the team spends its time on the users who are genuinely engaging.

Static lead lists and timeline-based follow-ups were hiding who was actually engaging. We ran a signal-led outbound pipeline where follow-ups fire on real behavior: outbound replies, onboarding progress and product usage.

Read the full research

Frequently askedquestions.

It tracks how people use your product, measures activation and retention, and shows where users drop out of key flows. The useful distinction between tools is whether the drop-off percentage connects back to the actual users, because that is what determines whether you can act on it.

Intempt Analytics

From percentage to person, in a click.

Paste one snippet. Your first funnel and retention report is live before your next sprint planning, with the users behind every number one click away.

Start for free